Home > Reports > Plan Strategy
Plan Strategy
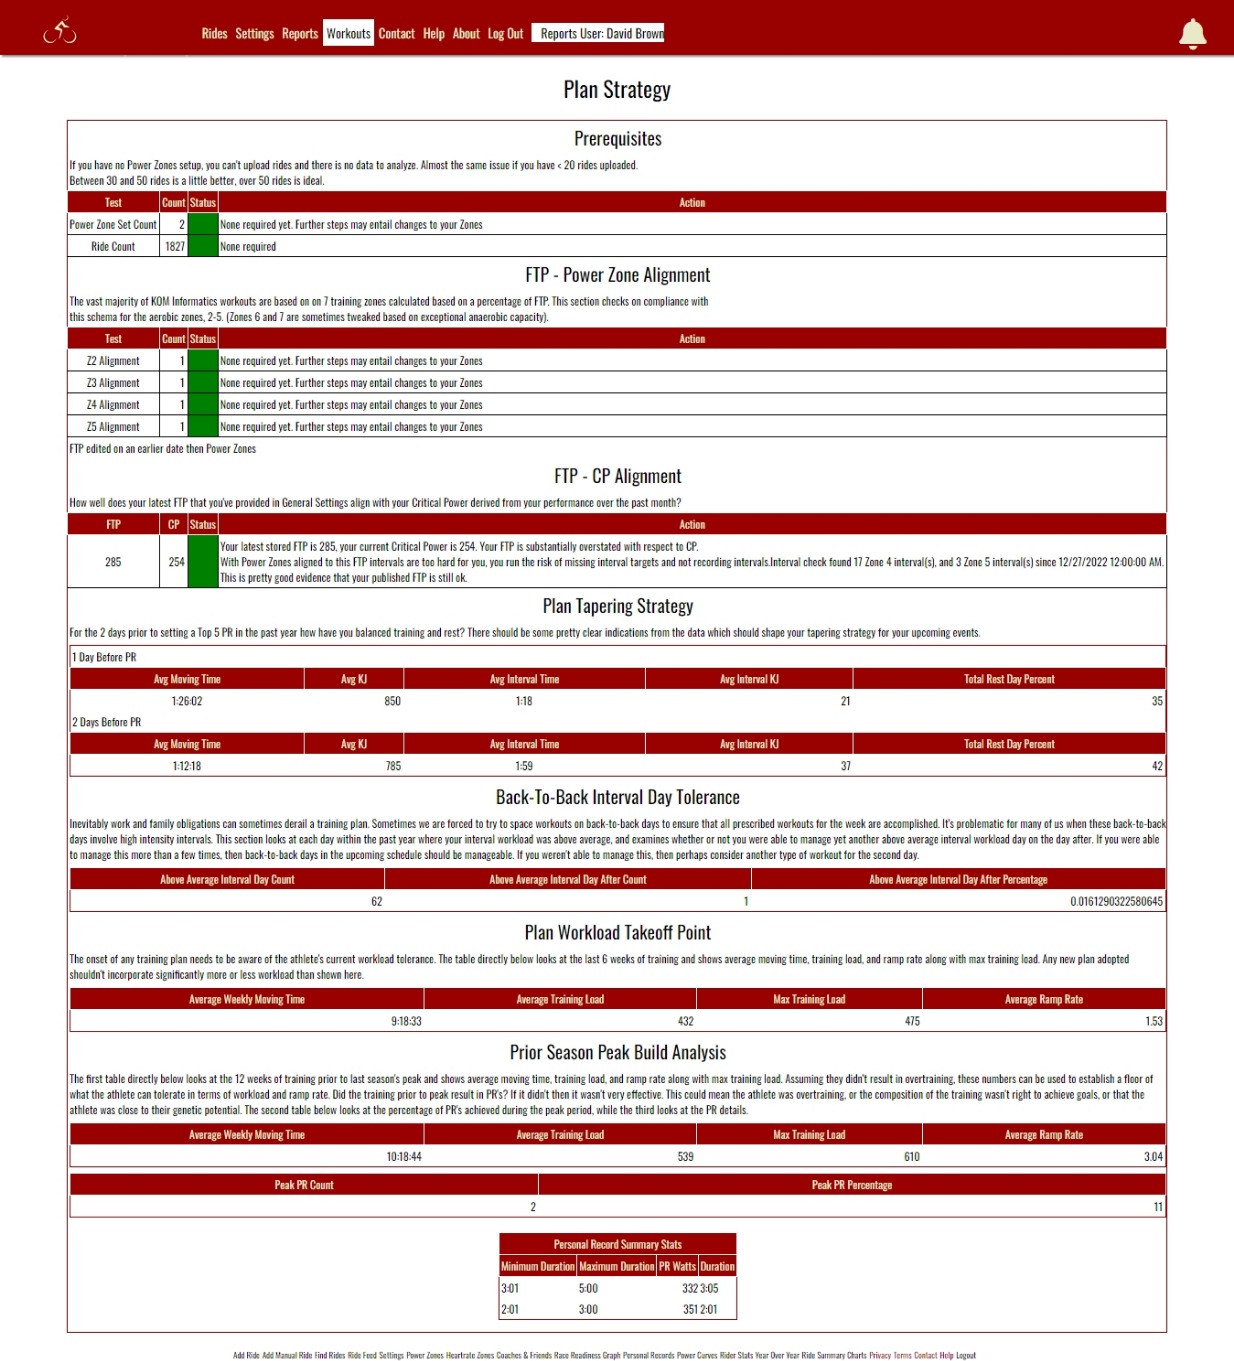
Plan Strategy Report. Plan Strategy helps athletes avoid mistakes that are sometimes "baked-in" to pre-made plans, and make more optimal decisions implementing training plans. The report is divided into several sections
More than a few athletes have an issue with incorrect training zones. A training plan can quickly derail if workouts are built around zones that are too easy or too hard. The vast majority of KOM Informatics workouts are based on a 7 zone schema, based on a percentage of FTP. The software checks for compliance with the schema for zones 2-5. If the training zones are compliant with the latest FTP you've provided, than how well does this FTP align with tested critical power over the last month? If the software reports that FTP is substantially overstated with respect to tested CP it means that the athlete hasn't been making the type of longer efforts that impress the CP algorithm. In this event the software will test for the presence of Z4 and Z5 intervals within the last 4 weeks. If the athlete is still performing these types of intervals, this is pretty good evidence that the zones they are based on are still ok.
Your plan may result in high fitness for your big event, but you still may need some guidance as to how to taper for optimal results on race days. This section looks at your rides both 1 and 2 days before your PR's for the past year were set and looks at average moving times and kj expended, average interval times and kj expended, along with what percentage of those days involved total rest. There are a lot of individual differences here! Learning how you attained a PR in the past allows you to apply that strategy again in the future.
Inevitably work and family obligations can sometimes derail a training plan. Sometimes we are forced to try to space workouts on back-to-back days to ensure that all prescribed workouts for the week are accomplished. It's problematic for many of us when these back-to-back days involve high intensity intervals. This section looks at each day within the past year where your interval workload was above average, and examines whether or not you were able to manage yet another above average interval workload day on the day after. If you were able to manage this more than a few times, then back-to-back days in the upcoming schedule should be manageable. If you weren't able to manage this, then perhaps consider another type of workout for the second day.
The onset of any training plan needs to be aware of the athlete's current workload tolerance. The table directly below looks at the last 6 weeks of training and shows average moving time, training load, and ramp rate along with max training load. Any new plan adopted shouldn't incorporate significantly more or less workload than shown here.
This section looks at the 12 weeks of training prior to last season's peak and shows average moving time, training load, and ramp rate along with max training load. Assuming they didn't result in overtraining, these numbers can be used to establish a floor of what the athlete can tolerate in terms of workload and ramp rate. Did the training prior to peak result in PR's? If it didn't then it wasn't very effective. This could mean the athlete was overtraining, or the composition of the training wasn't right to achieve goals, or that the athlete was close to their genetic potential. The section further looks at the percentage of PR's achieved during the peak period, and the PR details.
Here is a screenshot of the report.
See also